
Dataset dashboard
The dataset manager — the browser viewer's second page — curates the dataset manifests a training run is driven off. Since v10.22.0 it has two depths: an overview of every manifest in the picked directory, and the per-manifest curation view that page always had. Everything on this page runs client-side against the viewer's own WASM build; no file is uploaded anywhere. Optionally, a local companion process (meshioplusplus-mcp --http, v10.23.0, below) scans manifests server-side with the full Python core — and is the process launching and monitoring PhysicsNeMo training will run through, the next item of the roadmap.
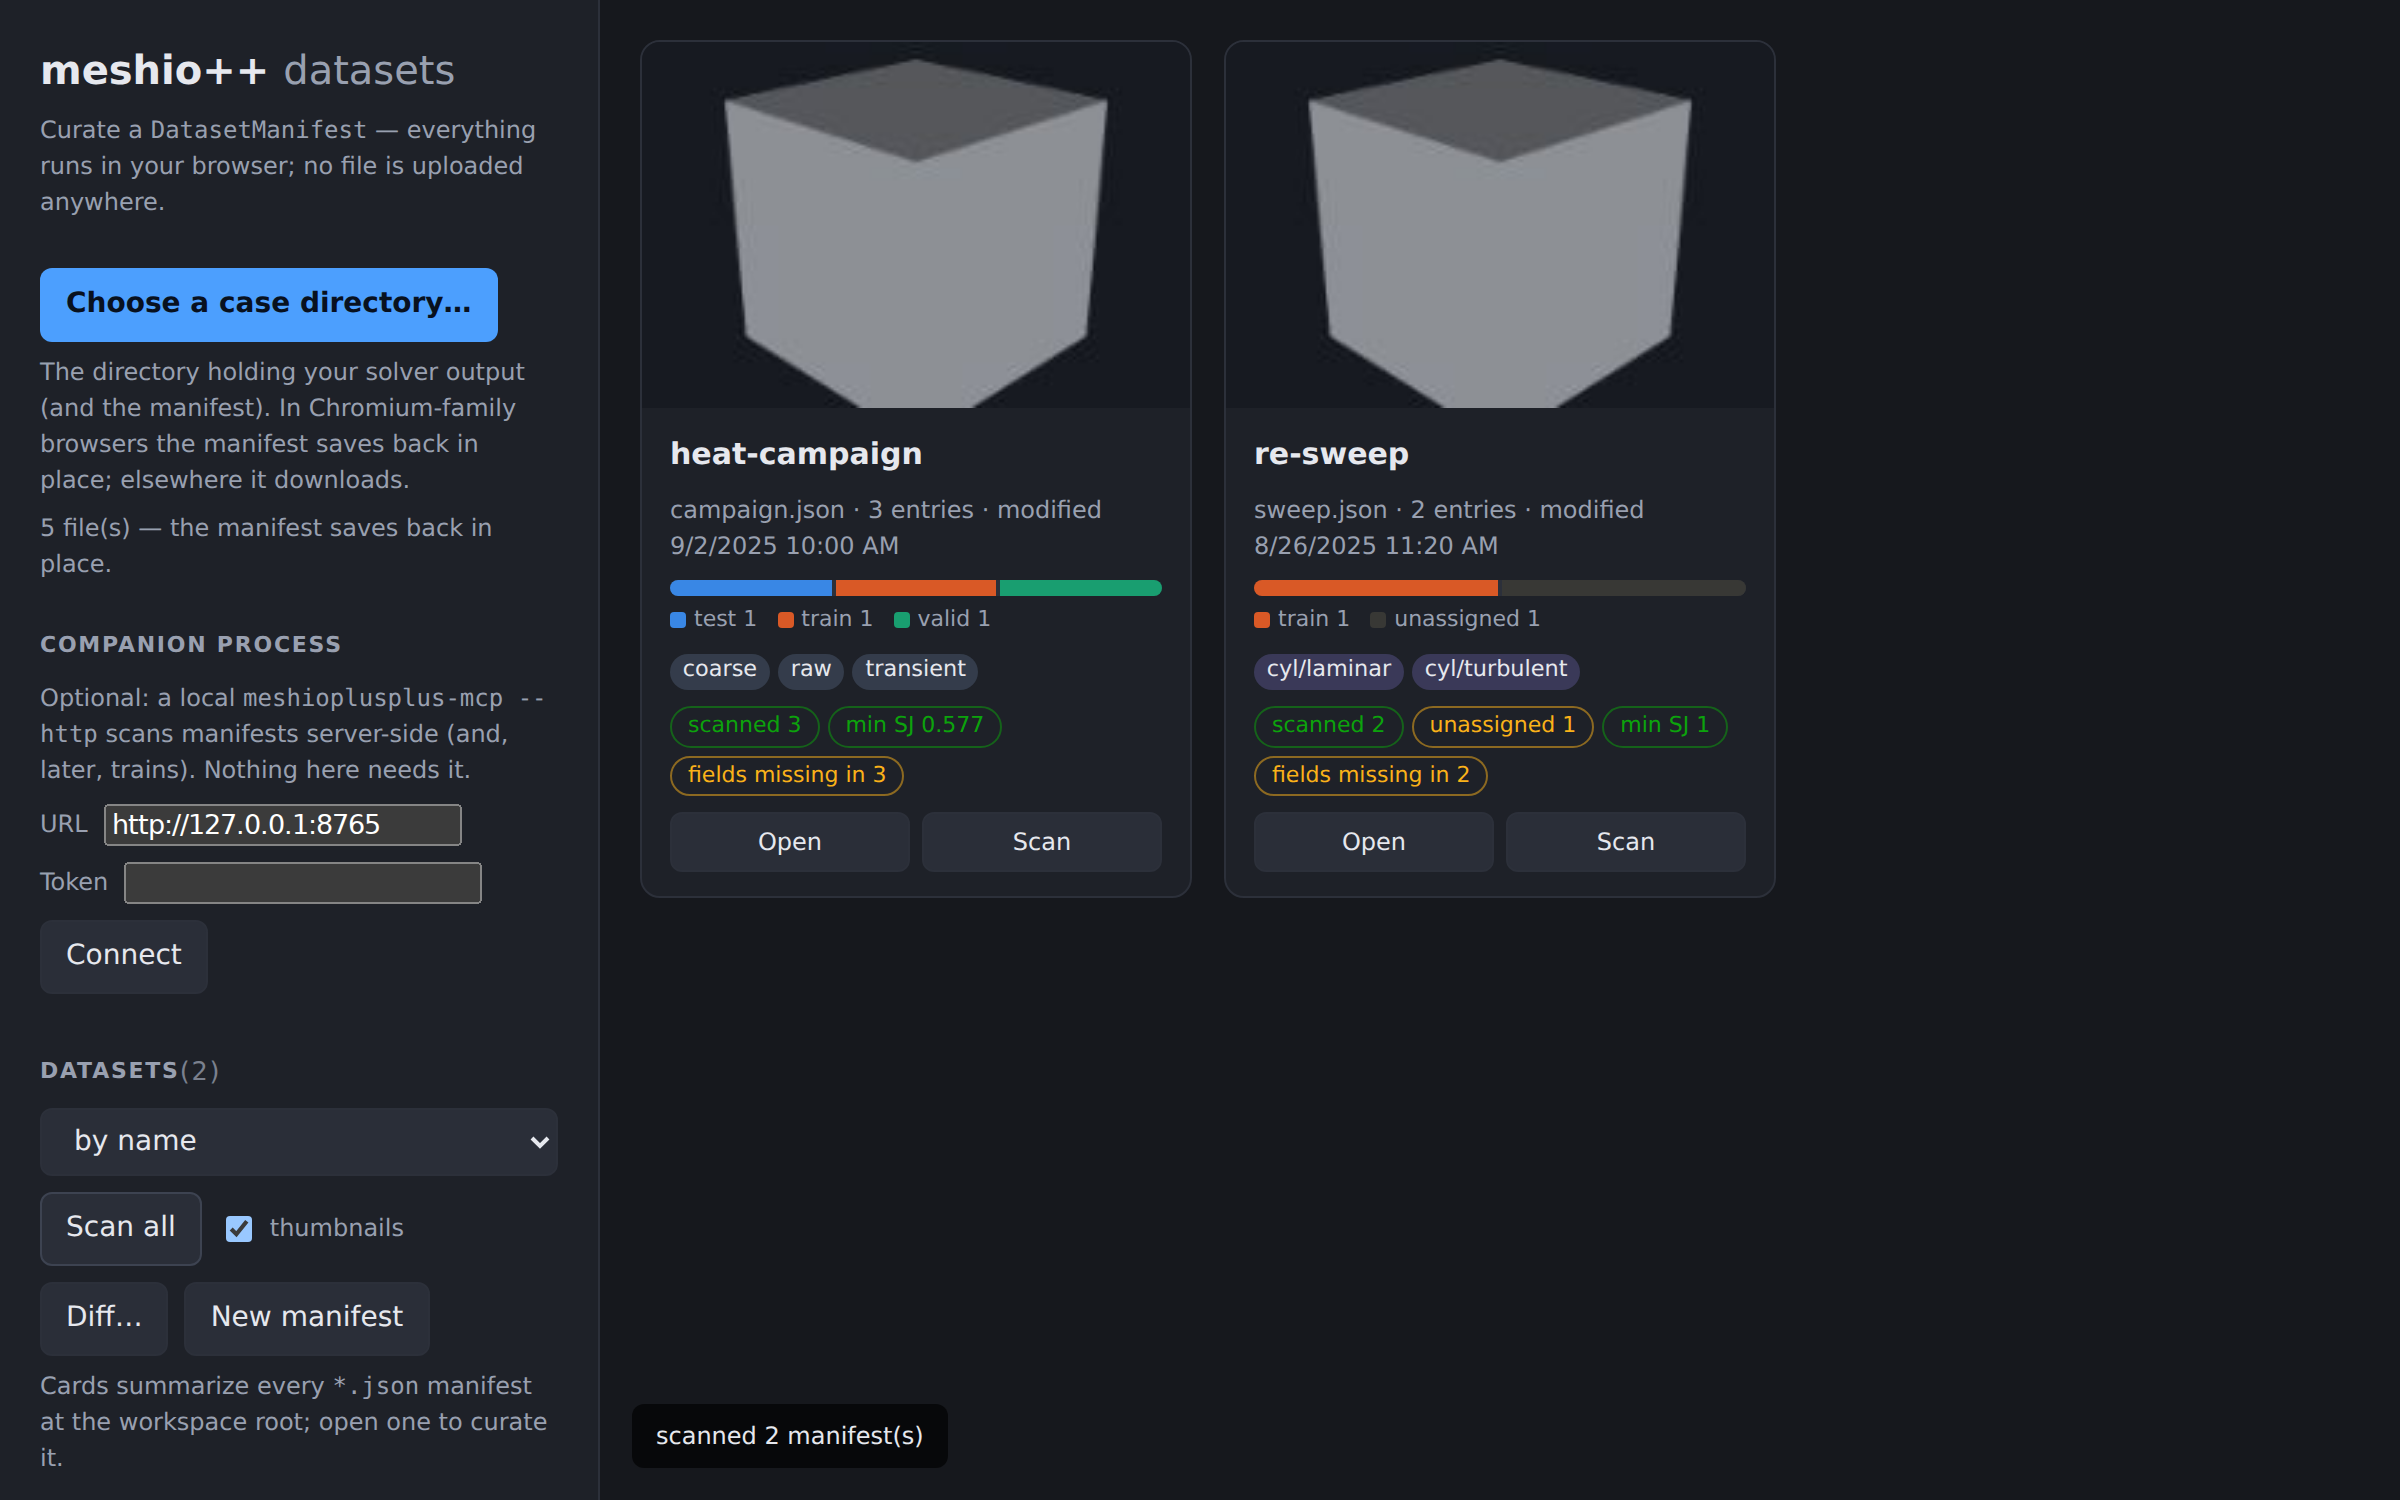
Two depths of one page
Picking a case directory (the File System Access picker in Chromium, a webkitdirectory input elsewhere — see the per-browser table) lands on the overview. Every *.json file at the workspace root is parsed as a manifest and shown as a card; Open drills into that manifest's curation view (entries, detail editor, preview, scan), and ← All datasets returns to the grid. Unsaved edits survive the round trip — the card of the manifest being edited is flagged, its counts and split balance follow the in-memory document, and opening it again does not re-read the file underneath your changes. Scan all refuses to run while a manifest has unsaved edits, since it opens every manifest in turn.
The page's state hook, window.__datasetState, records which depth is showing (view), the cards (manifests) and the last diff (diff), which is what the Playwright suite asserts on.
Overview cards
Each card shows the manifest's name (or path), its description, the entry count and the file's last-modified time, a proportional split-balance bar with a colour-and-label legend (split colours are assigned in a fixed order by sorted split name across the whole workspace, so train is the same colour on every card; unassigned entries are the grey tail), the union of its tags and groups as chips, its health badges (below), and a thumbnail. Cards sort by name, entry count, last-modified time or health (worst first).
A manifest the strict parser rejects — an unknown key, a duplicate id, invalid JSON — is still a card, flagged with the parser's message, rather than a silently missing one: a broken manifest is exactly what an overview should surface. New manifest starts an empty dataset.json in the curation view; it gets a card of its own until it is saved.
Thumbnails are captured from the preview render — the first time an entry of a manifest is previewed, and during Scan all when thumbnails is ticked — and live only for the session; a card only ever lacks a thumbnail, never shows a stale one.
Health summaries
Scan (in a manifest's curation view, or the card's own Scan button) stages every entry once, one at a time, and summarizes its data arrays and quality metrics at step 0. The per-entry scan records the step count, NaN/Inf counts over the data arrays, the inverted and degenerate cell counts, the worst scaled Jacobian and the list of data arrays present. Scans are cached (in IndexedDB, keyed by the manifest, the entry and the newest modification time of its source files), so re-opening a manifest shows its health without re-staging anything and a changed source file invalidates only its own entry.
One rule is load-bearing, and it has a single home (src/viewer/src/dataset/health.ts): a quality:* metric's NaN means "does not apply to this cell type" by design — compute_quality's own convention — so quality rows are excluded from the NaN/Inf counts; a quality row flags red only on actual inverted or degenerate cells or a negative worst scaled Jacobian.
The manifest-level summary aggregates the scans into badges shown on the card and in the curation view's Health section:
| badge | meaning |
|---|---|
scanned k/n | how many entries have a scan (a partial scan is a warning) |
unassigned k | entries with no split |
NaN/Inf n, inverted n, degenerate n | totals over the scanned entries — a bad dataset is visible before a run wastes GPU time on it |
min SJ x | the worst scaled Jacobian (red below 0, amber below 0.2) |
fields missing in k | entries lacking a data array that every other scanned entry carries — the Health section lists which arrays; a mismatched field set is what makes feature_matrix fail at training time |
unreadable n | entries that could not be staged or summarized at all |
healthy | a fully scanned manifest with none of the above |
Everything here is computed in the browser from the same summaries the per-entry table shows. With a companion process connected, Scan (server) — on a card, or in the curation view — asks the server for the same summary instead (dataset_health, the full Python compute_quality + data_info over every entry, one mesh alive at a time, nothing staged in the browser), which fills the same ManifestHealth shape with producer: "server" and the entry badges alike; the two producers apply the same quality-NaN rule.
Diffing manifests
Diff… compares two manifests side by side. Either side can be the open manifest on disk, its current edits, any manifest at the workspace root, or pasted JSON. The result is structural first — document fields that changed, entries added, entries removed, and for each entry present in both the fields that differ (split, tags, group, notes, metadata, source; metadata is compared by value, so key order never reads as a change) — followed by a line diff of the two serializations with unchanged context collapsed. Because the manifest serialization is stable (indent=2, fixed key order, trailing newline), the line diff of a hand edit is as clean as git diff's.
Git history is out of a browser page's reach: to compare against a revision, paste the output of git show REV:dataset_manifest.json as one side.
The companion process
Everything above runs with no server. What a browser page cannot do — scan a manifest too large to stage in WebAssembly, and (next) train a model — runs through a small local process the page connects to: the MCP server itself, started over HTTP.
pip install "meshioplusplus[dashboard]"
meshioplusplus-mcp --http --root /path/to/cases
#   meshio++ companion process at http://127.0.0.1:8765
#     dataset manager: connect to http://127.0.0.1:8765 with token …
#     MCP over HTTP (streamable-http): http://127.0.0.1:8765/mcp
Paste the URL and token into the page's Companion process panel and connect; the connection is remembered (in IndexedDB, like the directory handle) and retried on the next visit. Everything server-dependent stays hidden until the health probe succeeds, so a page with no server looks exactly as before.
What it serves. One process, one token, two surfaces: MCP over streamable HTTP at /mcp (so an agent can be pointed at it with claude mcp add --transport http …), and a JSON API for this page — GET /api/health (version, root, the tool list), POST /api/tools/<name> with the tool's keyword arguments as a JSON object (every registry tool, dispatched through the same path sandbox and strict-JSON sanitizer MCP uses; a tool failure is a 200 with {"error", "error_type"}, an unknown tool a 404), and GET /api/files?path= (a sandboxed download, for the checkpoints and predictions of a later release). Two tools exist for this page in particular: dataset_find lists the manifests under the server's root with their SHA-256, and dataset_health is the server-side producer of the health summary.
How cards bind. The File System Access API never reveals an absolute path, so a browser card and a server manifest can only be matched by their bytes: the page hashes each manifest it reads and dataset_find reports the server's hashes, and a card whose hash matches is bound (it shows an on server chip and a Scan (server) button). A manifest the server has that is not in the picked directory appears as a server-only card — it can be scanned but not opened here, since curating it means picking the directory that holds it. An unsaved edit changes the bytes, so a dirty card is unbound until it is saved.
Security posture, stated. The server binds the loopback interface by default and requires a bearer token on every /api/* and /mcp* request; the token is generated per start (or fixed with --token), --no-token turns the check off for a machine you alone use, and --host 0.0.0.0 prints a warning because whoever reaches the port with the token can read and write files under the root. Paths inside a request body — a manifest path, and the paths a hand-edited manifest resolves to — go through the same --root containment every MCP tool applies. CORS admits loopback origins on any port (a local npm run dev/preview) and the hosted docs site, so the GitHub-Pages copy of this page can call a server on your own machine (--allow-origin extends the list); Chromium and Firefox treat http://127.0.0.1 as potentially trustworthy from an https page and Chrome's Private Network Access preflight is answered, while Safari blocks the mixed-content call — run the page locally there. The one place the token rides a URL is GET /api/files?token=, because a download link cannot set a header.
The architecture rule the MCP server already follows carries over: src/python/meshioplusplus/mcp/_http.py is the only module importing Starlette/uvicorn, _health.py (the producer) is pure stdlib + meshioplusplus and tested in the default CI matrix, and the FastMCP app is the root ASGI application with the /api routes added to it — its own lifespan starts the streamable-HTTP session manager, which mounting it under a parent app would silently skip.
Launching and monitoring a run
With a companion process connected, a manifest's drill-down grows a Training section: pick the input and target fields (read from the manifest's own first entry), the train and validation splits, the hyperparameters, and Start training. The run is a job on the server — a python -m meshioplusplus.physicsnemo.train --spec subprocess in its own run directory — and the page follows it.
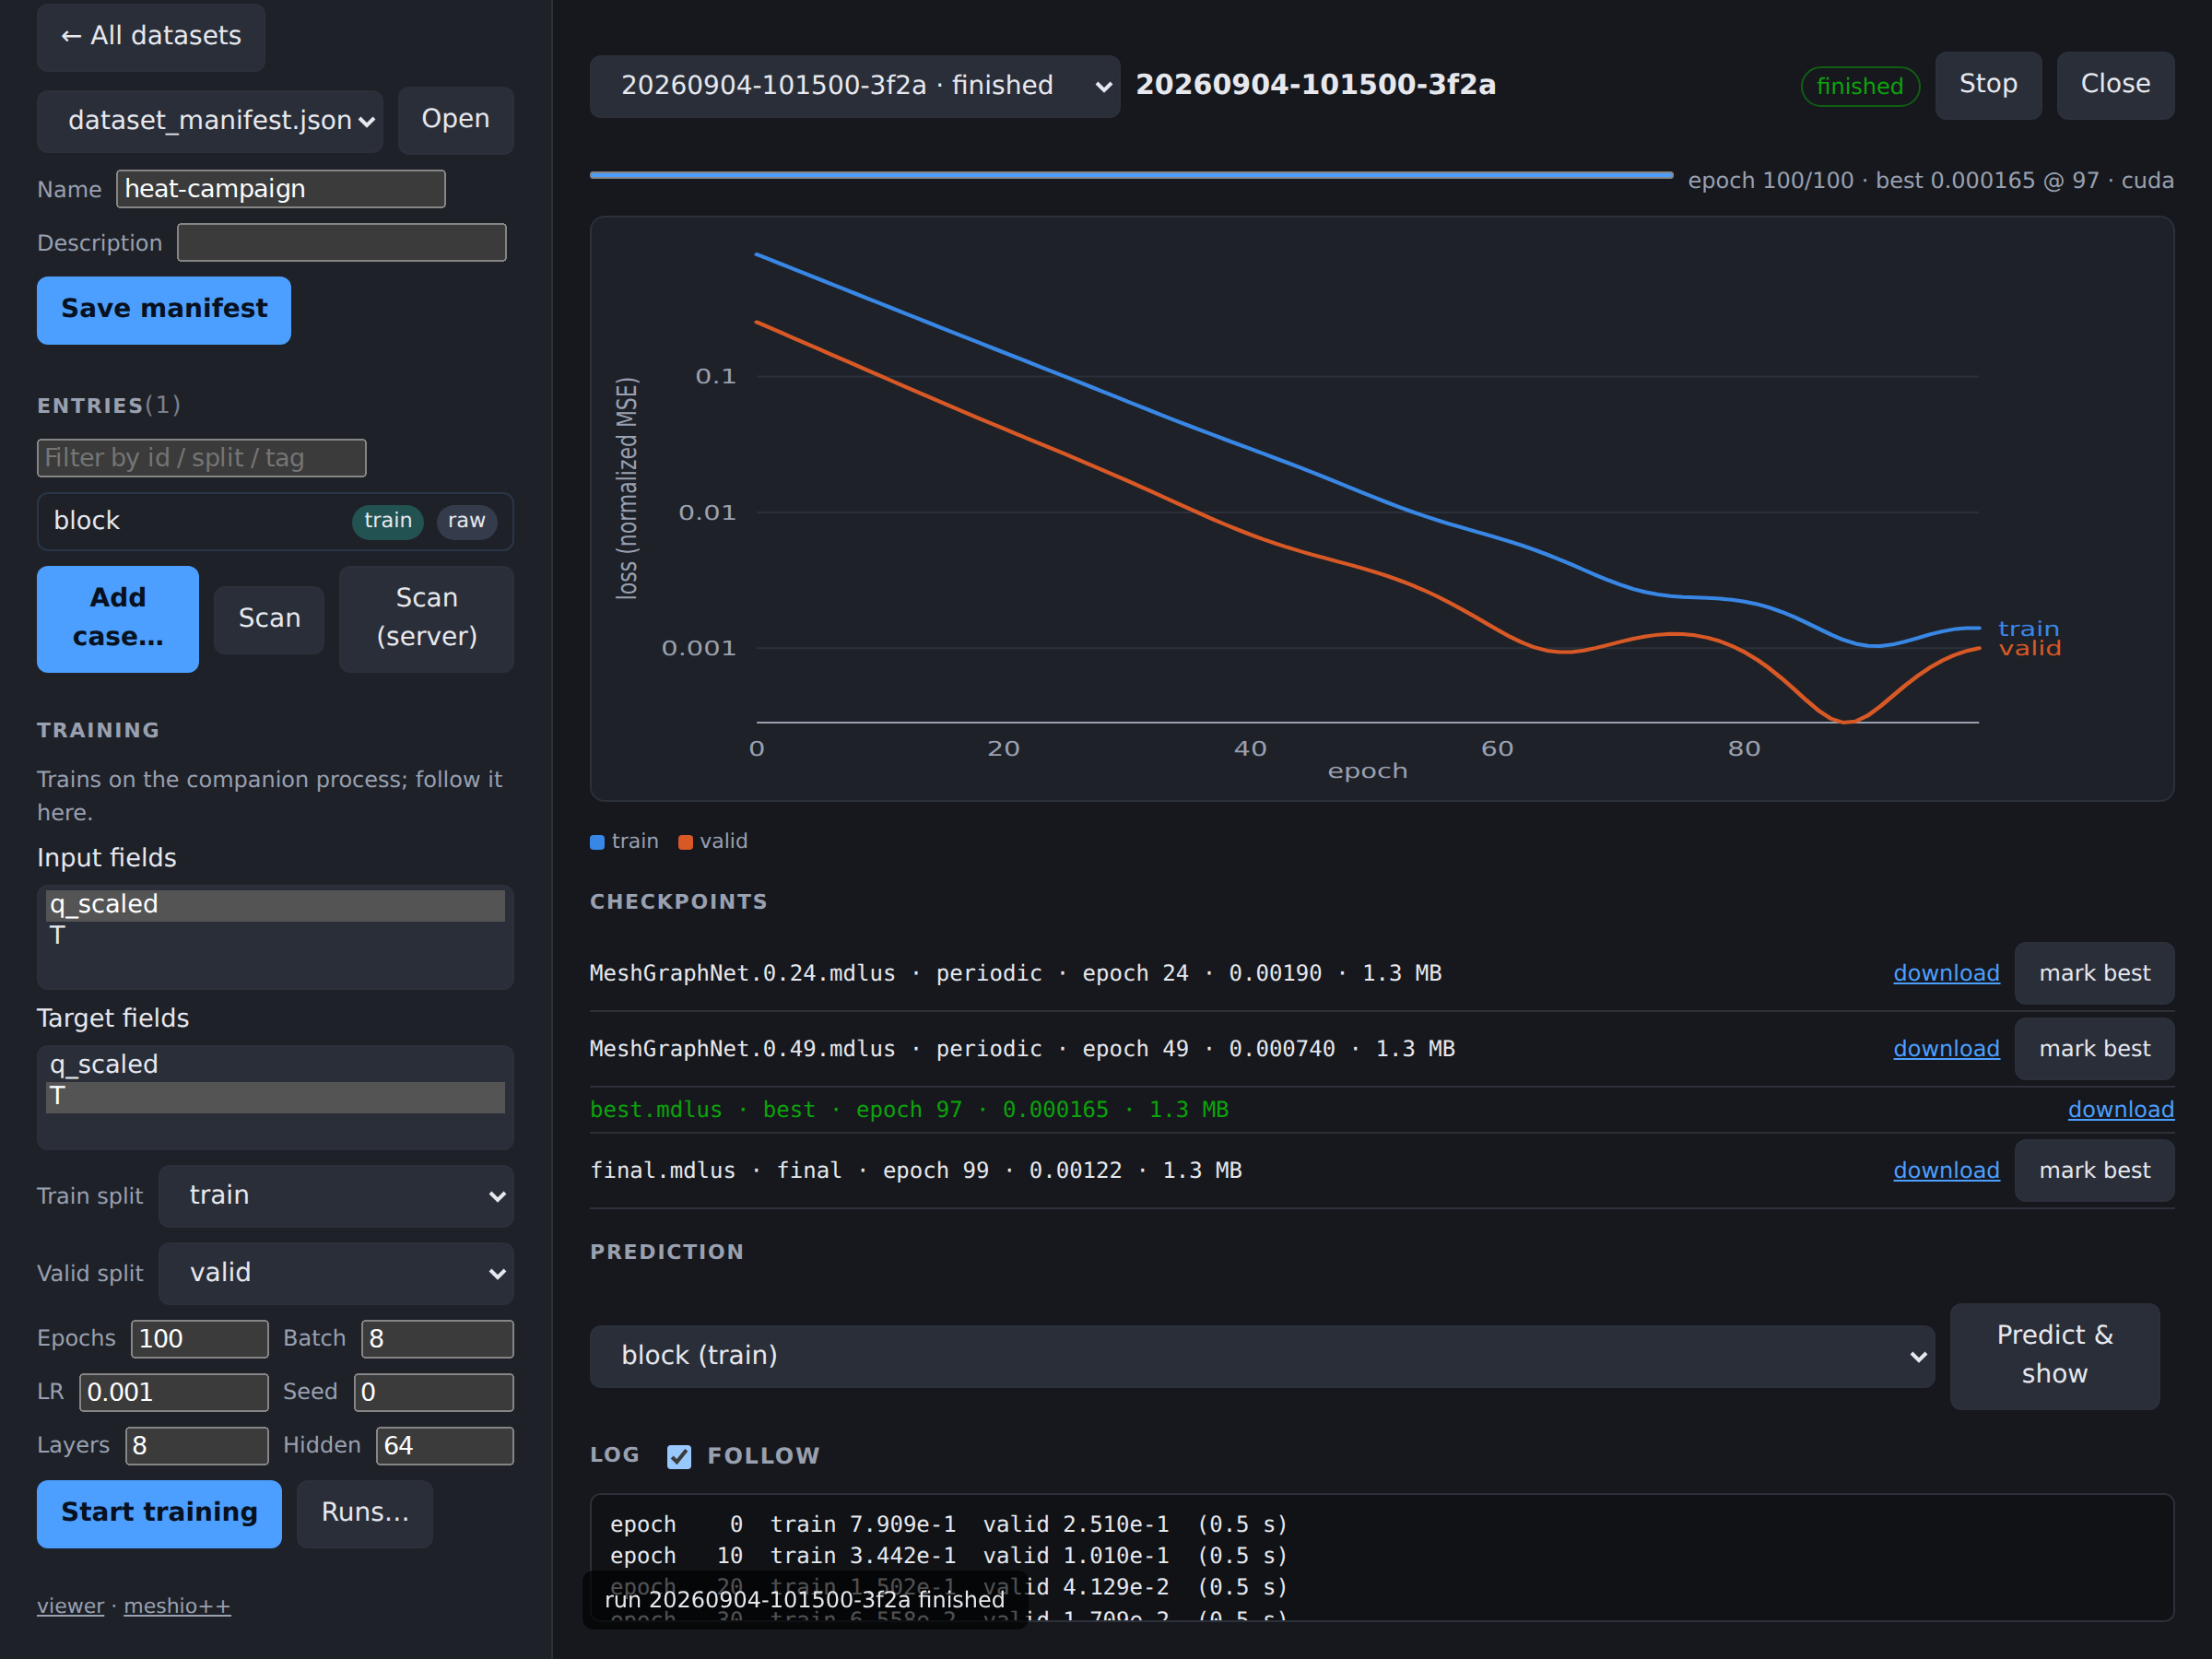
The run panel polls three incremental tools and shows what they return: train_status (the epoch, the best validation loss so far, an ETA, the device), train_metrics since the last epoch it has (the train/valid loss curve, log-scaled, with a hover crosshair), and train_log from the last byte offset (the trainer's stdout, with a follow toggle). Stop sends SIGTERM, which the trainer honours by finishing its epoch and writing final.mdlus — a stopped run leaves a usable checkpoint, not a truncated one. When a run reaches a terminal state the page raises a browser notification (permission is asked from the Start click, and the run never waits on the answer); with notifications refused the tab title carries the outcome instead.
Each checkpoint is listed with its epoch, validation loss and size, a download link (through the sandboxed /api/files route) and mark best, which copies it — and its model card — to best.mdlus, which is what train_predict and the example's infer.py then use.
Two things follow from where training actually runs. The form is enabled only for a manifest the server can see, i.e. one whose bytes match a manifest under the server's root — an unsaved edit unbinds the card, and the hint says so. And the Runs… button lists the server's jobs, so closing the tab does not lose a run: reconnecting and picking it from the list resumes following it exactly where the files say it is.
Comparing runs
Runs… opens the history: every run the server knows, with its status, epochs, best validation loss, duration and tags, filterable and sortable (an unknown value sorts last in both directions — a run that never reported a validation loss is not the best one). Clicking a run's id opens it in the run panel.
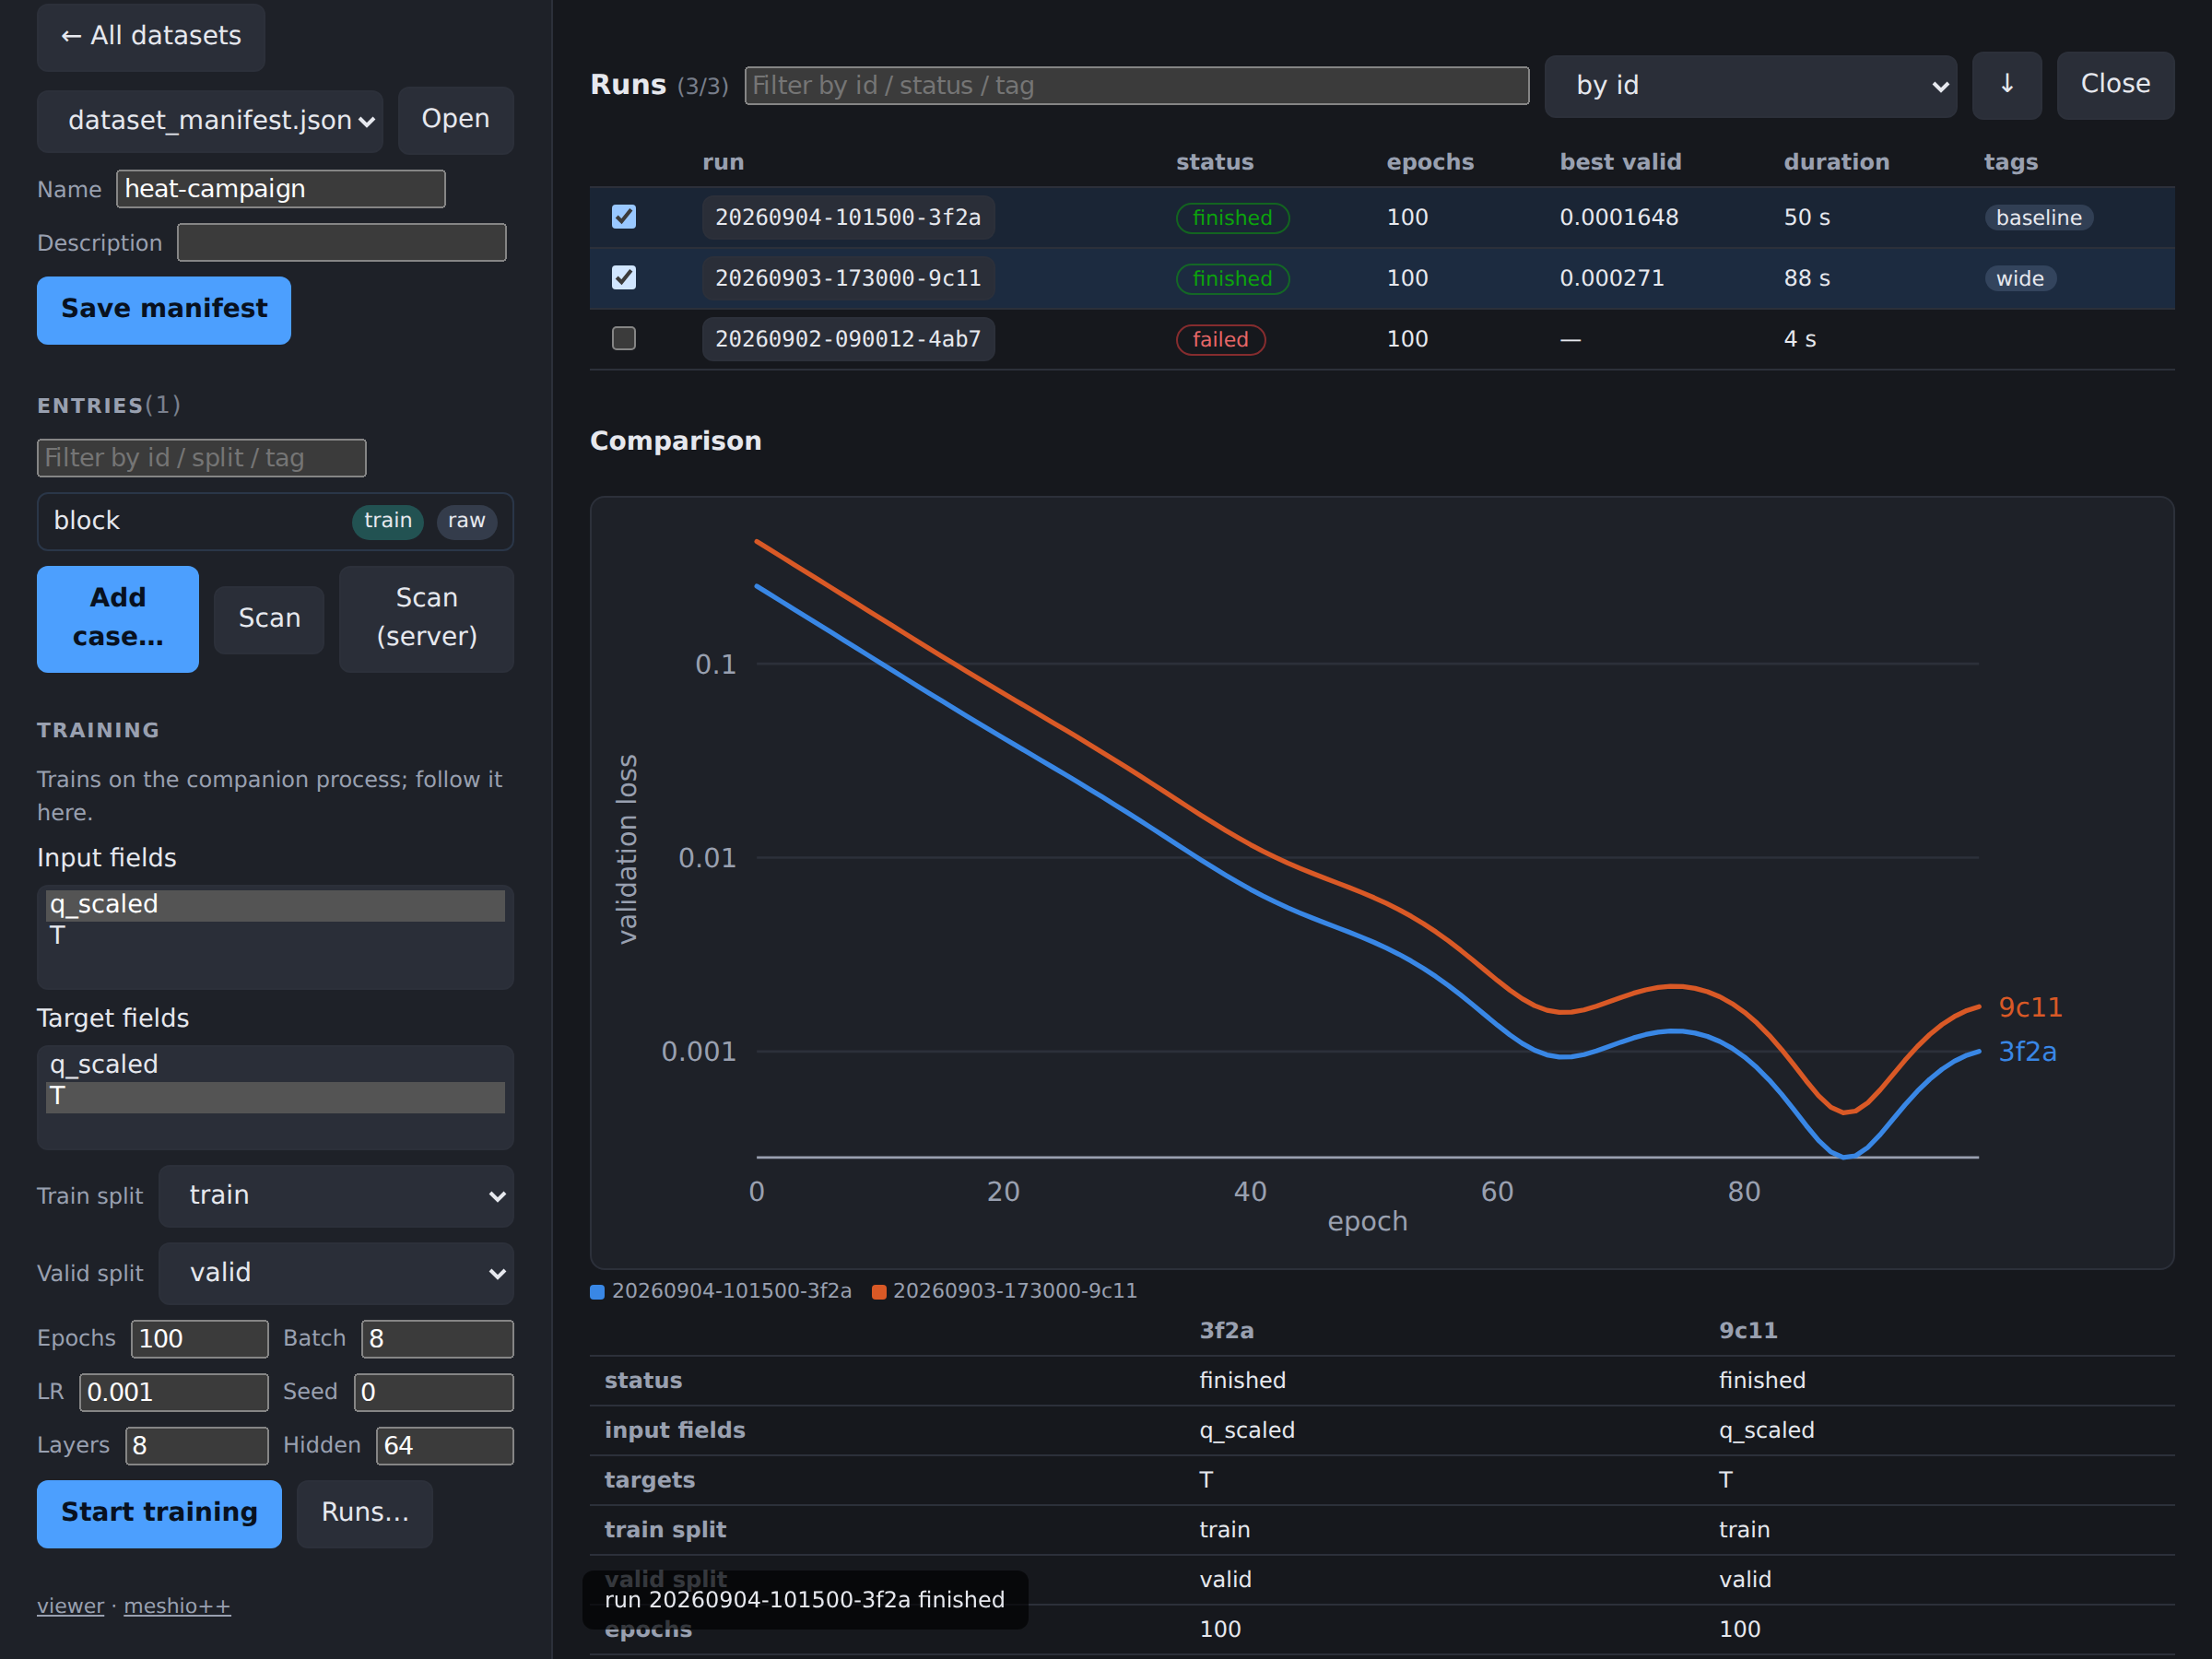
Ticking runs compares them: their validation curves overlaid on one chart, and their hyperparameters side by side with only the rows they disagree on highlighted, which is the question a comparison is actually asked — what was different, and did it help.
Three runs is the cap, and it is a measured one. Overlaid curves cross, so their colours have to be distinguishable in every pair rather than only between neighbours; under that rule the categorical palette's first three slots pass on this page's surface and the fourth (yellow beside orange) fails both the colour-vision and the normal-vision floors. A fourth selection is refused with that reason rather than silently reusing a colour.
Previewing a prediction
The run panel's Predict & show takes one case, runs it through the run's best checkpoint on the server (train_predict), and renders the result in the same mesh viewer the rest of the page uses — coloured by the prediction's own error field, so the first thing on screen is where the model is wrong rather than a uniform grey solid. The picker defaults to a held-out case, since predicting on a training case rarely tells you anything.
The prediction is an ordinary .vtu the server wrote into the run's predictions/ directory: it is fetched through the same sandboxed download route the checkpoints use, and it goes into the viewer's own file slot, so the entry being curated stays staged.
Being told when a run ends
Three notifications, for three distances from the tab. The run panel updates live while it is open. A browser notification fires when a run reaches a terminal state (permission is asked from the Start click, and the run never waits on the answer); with notifications refused the tab title carries the outcome instead. And meshioplusplus-mcp --http --webhook URL POSTs a JSON payload — event (run.finished / run.failed / run.stopped), job_id, run_dir, status, exit_code, best_valid_loss, best_checkpoint — once per job, which reaches a chat channel or a CI system and survives the browser being closed entirely.
The webhook is a server-side setting, never a spec key or a tool parameter, for the same reason the trainer command is: a URL supplied by a client and then fetched by the server is server-side request forgery by design. It is posted from the one place a terminal transition is observed, so it fires exactly once however many clients are polling; with a webhook configured the server also runs a small watcher so a run that ends while nobody is looking still notifies.
Limitations
- Only
*.jsonfiles at the workspace root are treated as manifests: the manifest is the resolution anchor for the relative sources inside it, and the page saves back at the root. - Thumbnails are session-only and cost one preview render per manifest; untick thumbnails before Scan all on a large workspace.
- A scan stages exactly one entry at a time (the WASM filesystem never reclaims memory), so Scan all over many large manifests is serial and slow the first time; the scan cache makes the next visit instant.
- Five model families (MeshGraphNet, SRResNet, FNO, AFNO, DeepONet) share one training loop, and the launch form shows only the chosen family's options (
src/viewer/src/dataset/families.ts, a pure twin of the trainer's own family table); a different architecture still means a different trainer, not a form field. DeepONet is offered only when the companion process reports the experimentalDeepONetinstalled. - At most three runs compare at once (the colour limit above), and a comparison is of validation curves and hyperparameters — not of predictions.
- The companion process is a local convenience, not a multi-user service: one token, loopback by default, no accounts.