Field Visualization
The Field toolbar button (or the Field Visualization command) plots the data arrays stored in the file: NodalData, ElementalData, and ConditionalData for .mdpa, and point / cell data arrays for every VTK and mesh format. While a field is shown, the base mesh dims to wireframe so the coloring or glyphs stand out.
The panel
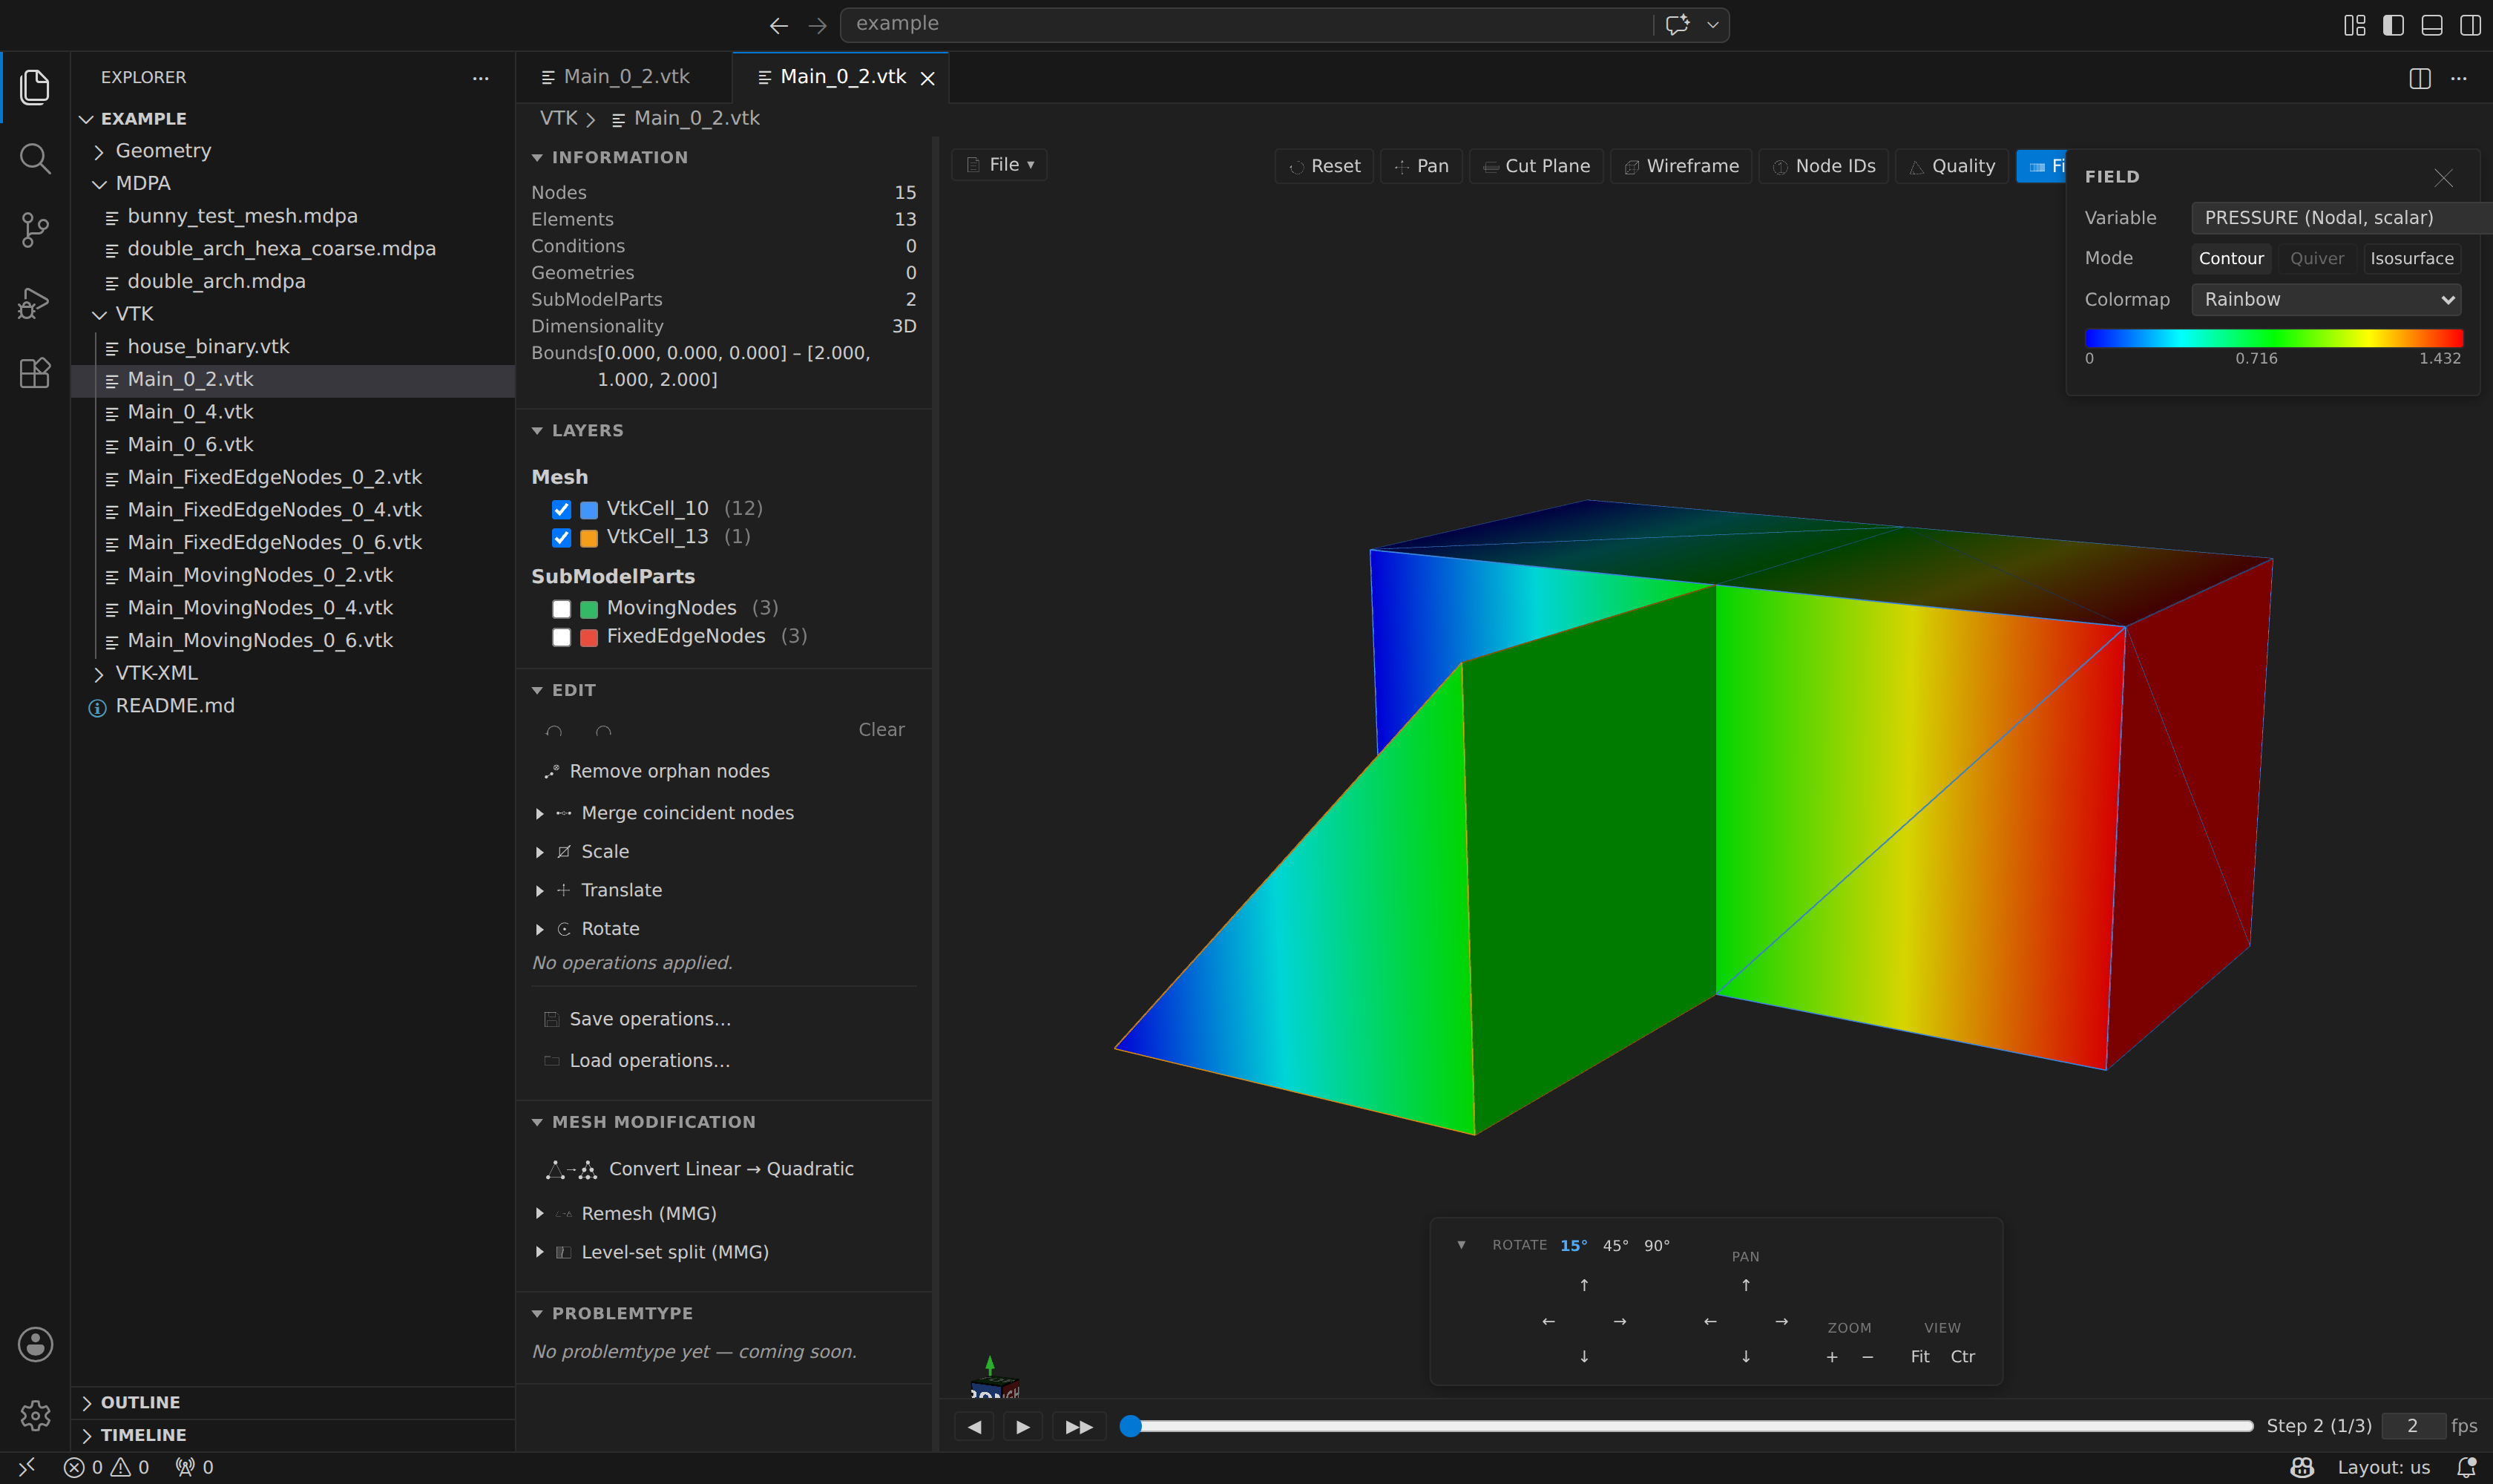
- Variable — pick any stored array. The dropdown labels each with its source (Nodal / Elemental / Conditional) and rank (scalar / vector).
- Modes — Contour, Quiver, Isosurface, Threshold, and Deformed shape (see below). Each is an independent toggle, so you can combine any of them at once (e.g. Contour + Quiver, or Deformed + Contour). Modes that don't apply to the current variable are disabled (Quiver / Deformed need a vector; Isosurface needs a scalar).
- Component — for a vector field with Contour, Isosurface, or Threshold active: color/threshold by Magnitude (default), or a single X/Y/Z component. Quiver always colors by magnitude.
- Colormap — Rainbow (jet, default), Viridis, Plasma, Inferno, Magma, Cividis, Turbo, Cool-warm, Blue-Orange, Spectral, HSV, or Grayscale. The choice drives the 3D coloring, the panel legend, and the optional in-scene scalar bar.
- Range — the color range defaults to the field's data range; type your own min/max to override it (the reset button restores the default), tick Log scale for a logarithmic mapping (only available when the range is strictly positive), and pick a Bands count (Continuous, 5, 10, or 20) for discrete color steps instead of a smooth gradient.
- Show scalar bar in scene — draws a legend directly in the 3D view (bottom-right) instead of only in the panel. Unlike the panel legend, this one is captured by the Screenshot button; leave it off and a screenshot still gets a legend composited onto it automatically.
Contour
Color the mesh by a scalar. Nodal fields are drawn as smooth interpolated point-data; elemental / conditional fields are drawn flat per cell. Vector fields are colored by magnitude. On a volume mesh, boundary faces inherit their owning cell's value.
Quiver
Draw arrow glyphs oriented and scaled by a vector field — at nodes for nodal data, or at cell centroids for elemental / conditional data — colored by magnitude. The Arrow scale slider tunes glyph length so the arrows read clearly whatever the field's units.
Isosurface
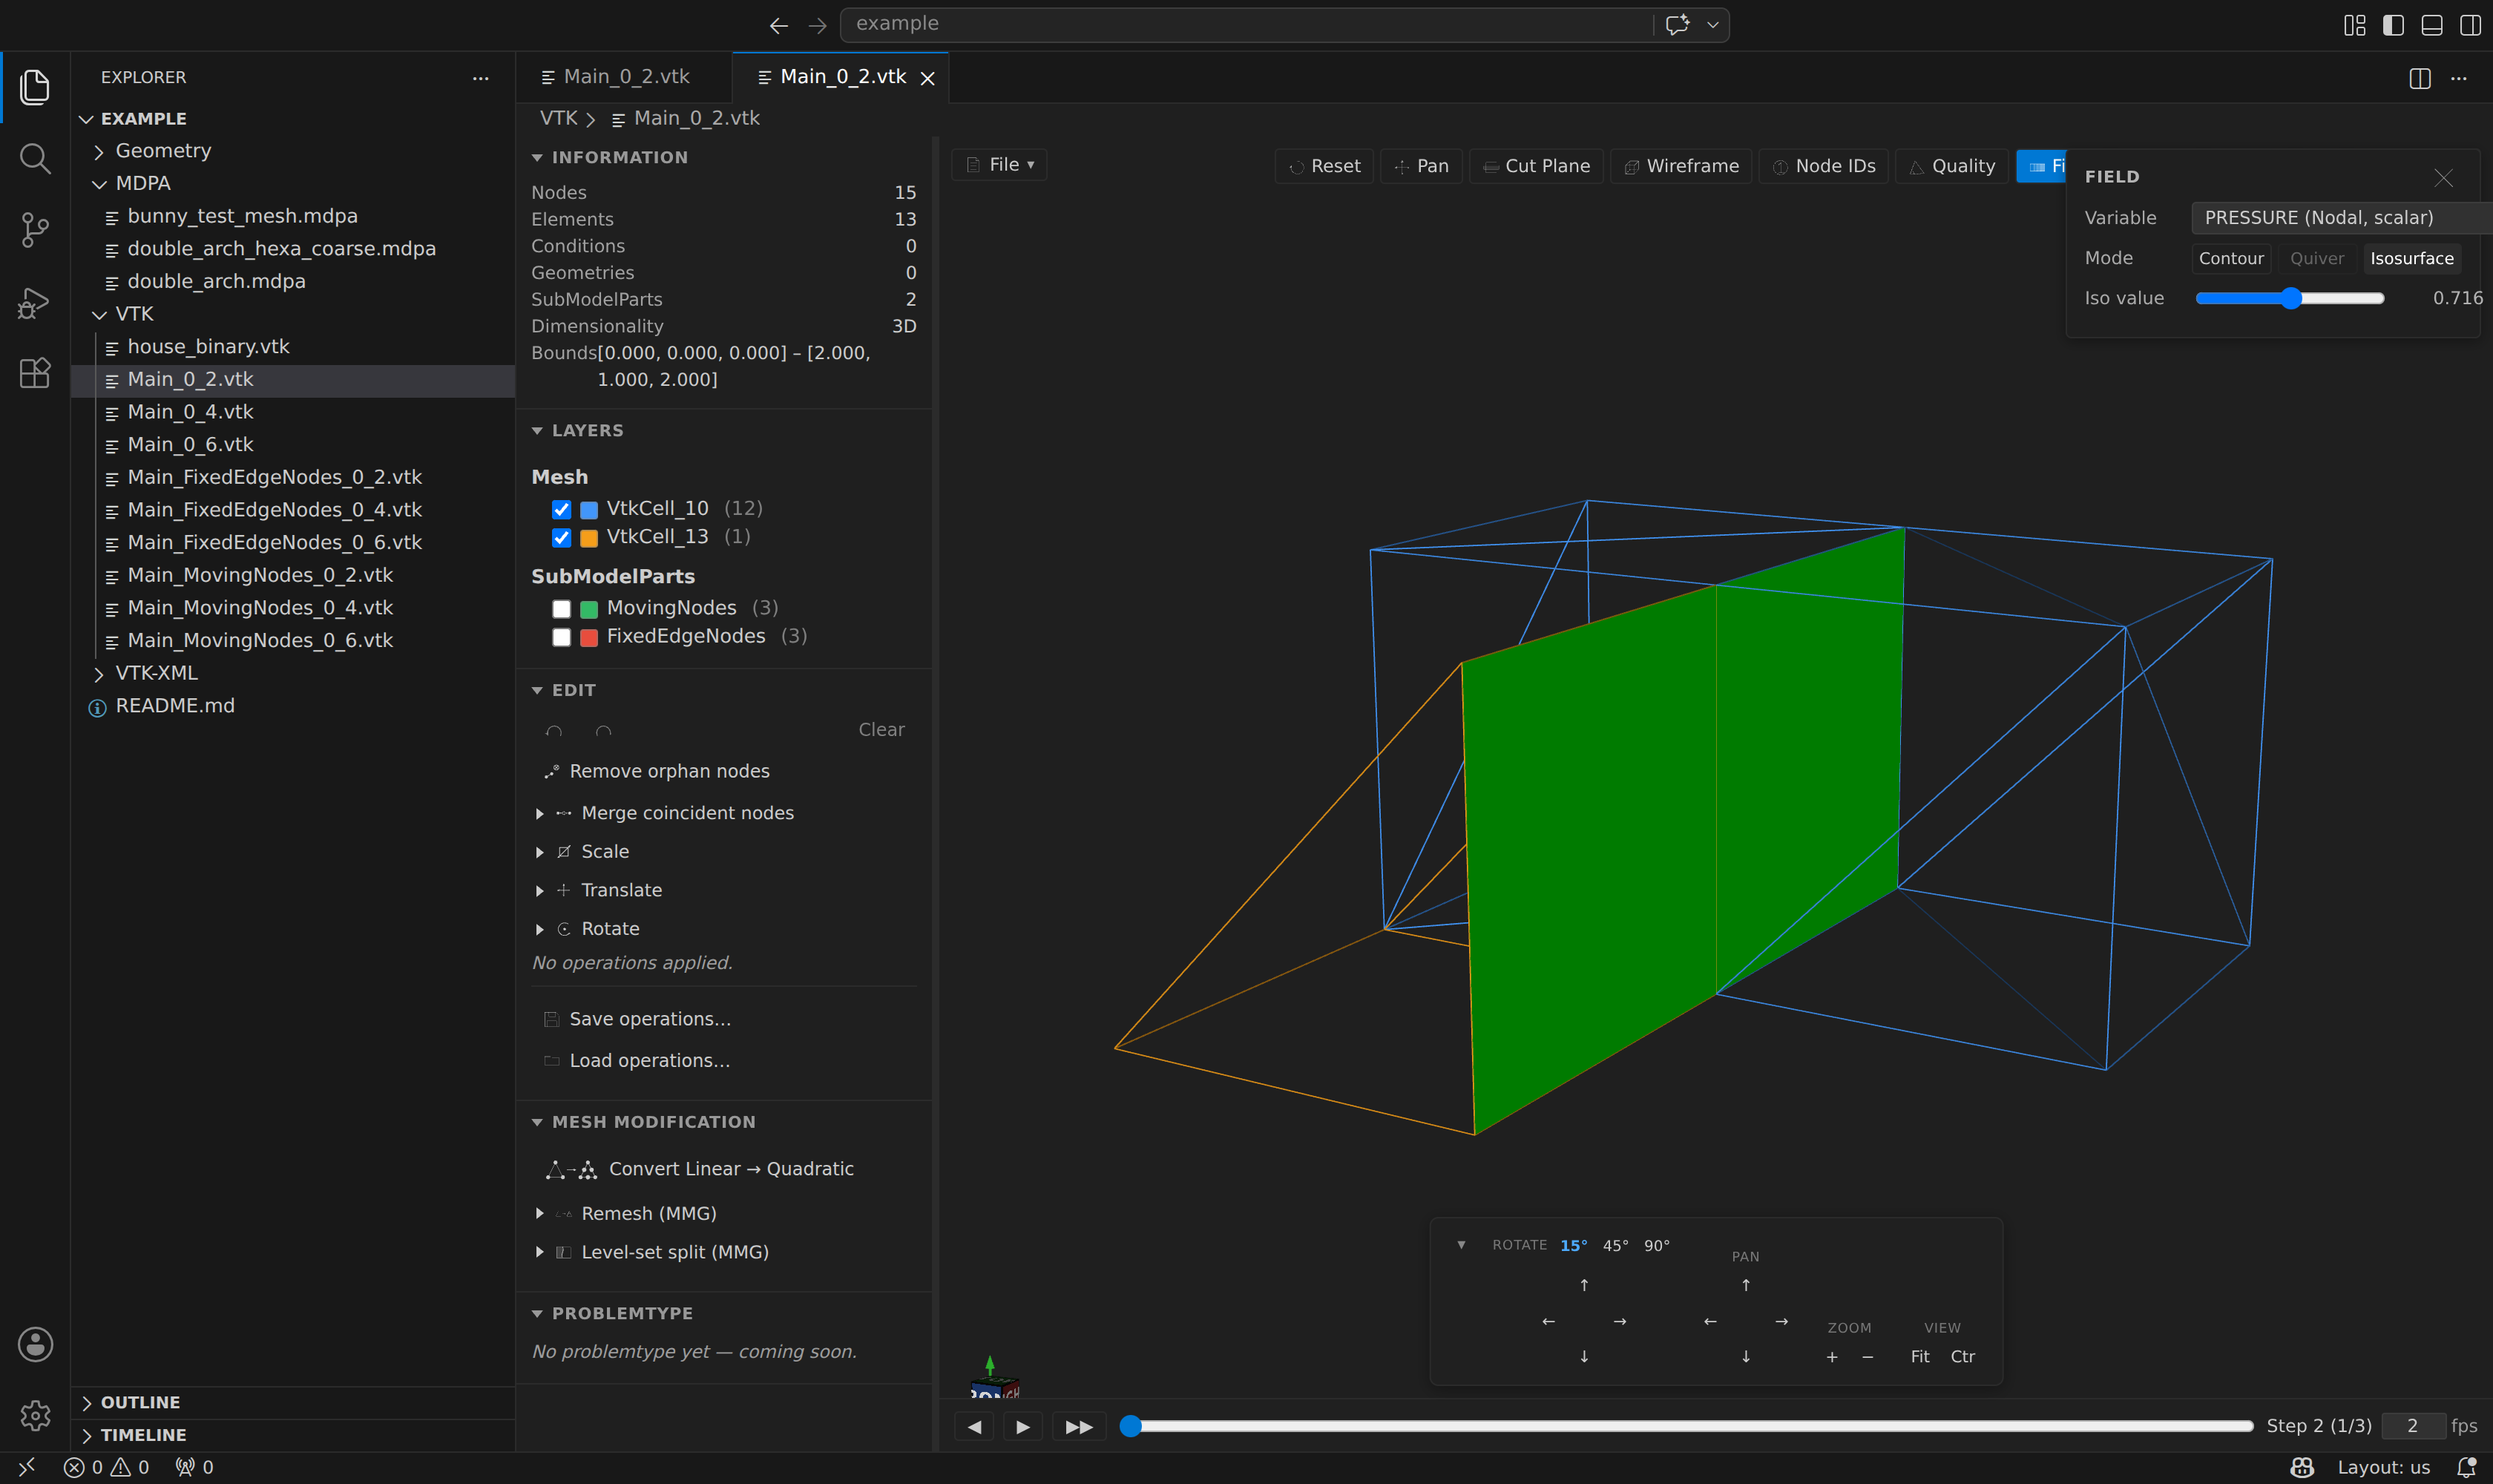
Extract the surface where a scalar equals a slider-driven iso value. On volume meshes this uses marching tetrahedra (each cell decomposed into tets); 2D and surface meshes fall back to iso-lines. A Count spinner adds more evenly-spaced values, each with its own independently-draggable slider, so you can see several iso-surfaces at once — drag any slider to sweep it through the field; the surfaces rebuild live.
Export isosurface… writes the isosurface(s) at the current values as a mesh file (.vtu, .vtp, .stl, .ply and every other exportable format). The file carries the interpolated nodal fields, the per-cell fields of each parent cell, ISO_VALUE and ISO_INDEX, and — so a face can be traced back — SOURCE_ENTITY_ID / SOURCE_ENTITY_KIND, the cell of your mesh it was cut from. Node and cell ids in the file are new. A cell (elemental) field is piecewise constant and has no level set, so it is refused by name; average it to the nodes first.
Threshold
Show only the Elements/Conditions whose value falls inside an editable "Show only" [min, max] window — everything outside it is hidden, the same way Clip hides geometry but driven by field value instead of position. For a nodal field, a Rule selector picks whether a cell needs all of its nodes in range, or any one of them. Combine with Contour to color the surviving cells by the field, or leave it uncolored to just isolate a region (e.g. "only the elements above yield stress").
Export region… turns that window into a mesh file — a real extraction rather than a view. The region keeps its original ids, groups, fields and Properties: the conditions and geometries still lying on it stay, SubModelParts and fields are narrowed to what survives, and constraints reaching outside are dropped and counted. The message states the selected share of the volume (area, or length, for a lower-dimensional mesh). Export boundary… writes the region's boundary surface instead (with new ids). The window is absolute, in the field's own units; the mesh_derive tool also accepts a normalized window against an explicit fixed reference range — per-frame rescaling against the frame's own range is opt-in, because it changes the physical threshold from one time step to the next.
Deformed shape
Warp the geometry by a vector field to visualize displacement — the standard FE post-processing view. The deformation has its own "Deform by" selector (independent of the coloring variable), so you can deform by DISPLACEMENT while coloring by a stress scalar, and a Warp scale slider exaggerates or damps the motion. The warp is global: with Deformed shape on, Contour, Quiver, and Isosurface all render on the deformed geometry, while the undeformed reference mesh stays visible as a wireframe. Combine Deformed + Contour for the canonical "deformed shape colored by displacement" plot.
TIP
See also Mesh size for a related Field-like view of the per-node and per-element mesh size, with a box-and-whisker of the element-size distribution.
TIP
For a Kratos time series, the active variable, mode, and colormap are preserved as you scrub the timeline, so a field animates across the steps.