The Toolbar
All top-level actions live in the header toolbar. Their behaviour is implemented in public/js/code.js and public/js/side.js.
Generate
Runs one execution step of the graph (graph.runStep()), invoking every node's onExecute(). This is what actually computes the configuration: data flows from source nodes (Problem Data, solvers, materials, processes…) through the connections into sink nodes (JSON Viewer, Export case). Run Generate whenever you want the JSON viewer or an export to reflect your latest changes.
Save / Load
- Save serialises the entire graph (nodes, widget values, positions and links) and downloads it as
graph.json. - Load reads a previously saved
graph.jsonback onto the canvas, restoring the whole editor state.
Use Save/Load to persist your work-in-progress. This is the FlowGraph-native format — it captures the graph, not the Kratos case. To produce a Kratos case, use Export a case.
Automatic backup
FlowGraph also writes a backup of the graph to the browser's localStorage on page unload, so an accidental refresh won't lose everything.
Export / Import (selections)
- Export serialises only the currently selected nodes and the links between them, and downloads them as
selection.json. This lets you capture a reusable sub-graph — for example a fully configured solver + linear solver + time stepping block. - Import loads a
selection.jsonback onto the canvas. Node and link IDs are remapped on import so the imported group never collides with nodes already present — you can import the same selection multiple times.
Selections are ideal for building a small library of pre-wired building blocks you reuse across projects.
Viewer
Toggles the JSON side panel (#side-viewer). When open, it renders the JSON produced by a connected JSONView node using a collapsible JSON tree viewer.
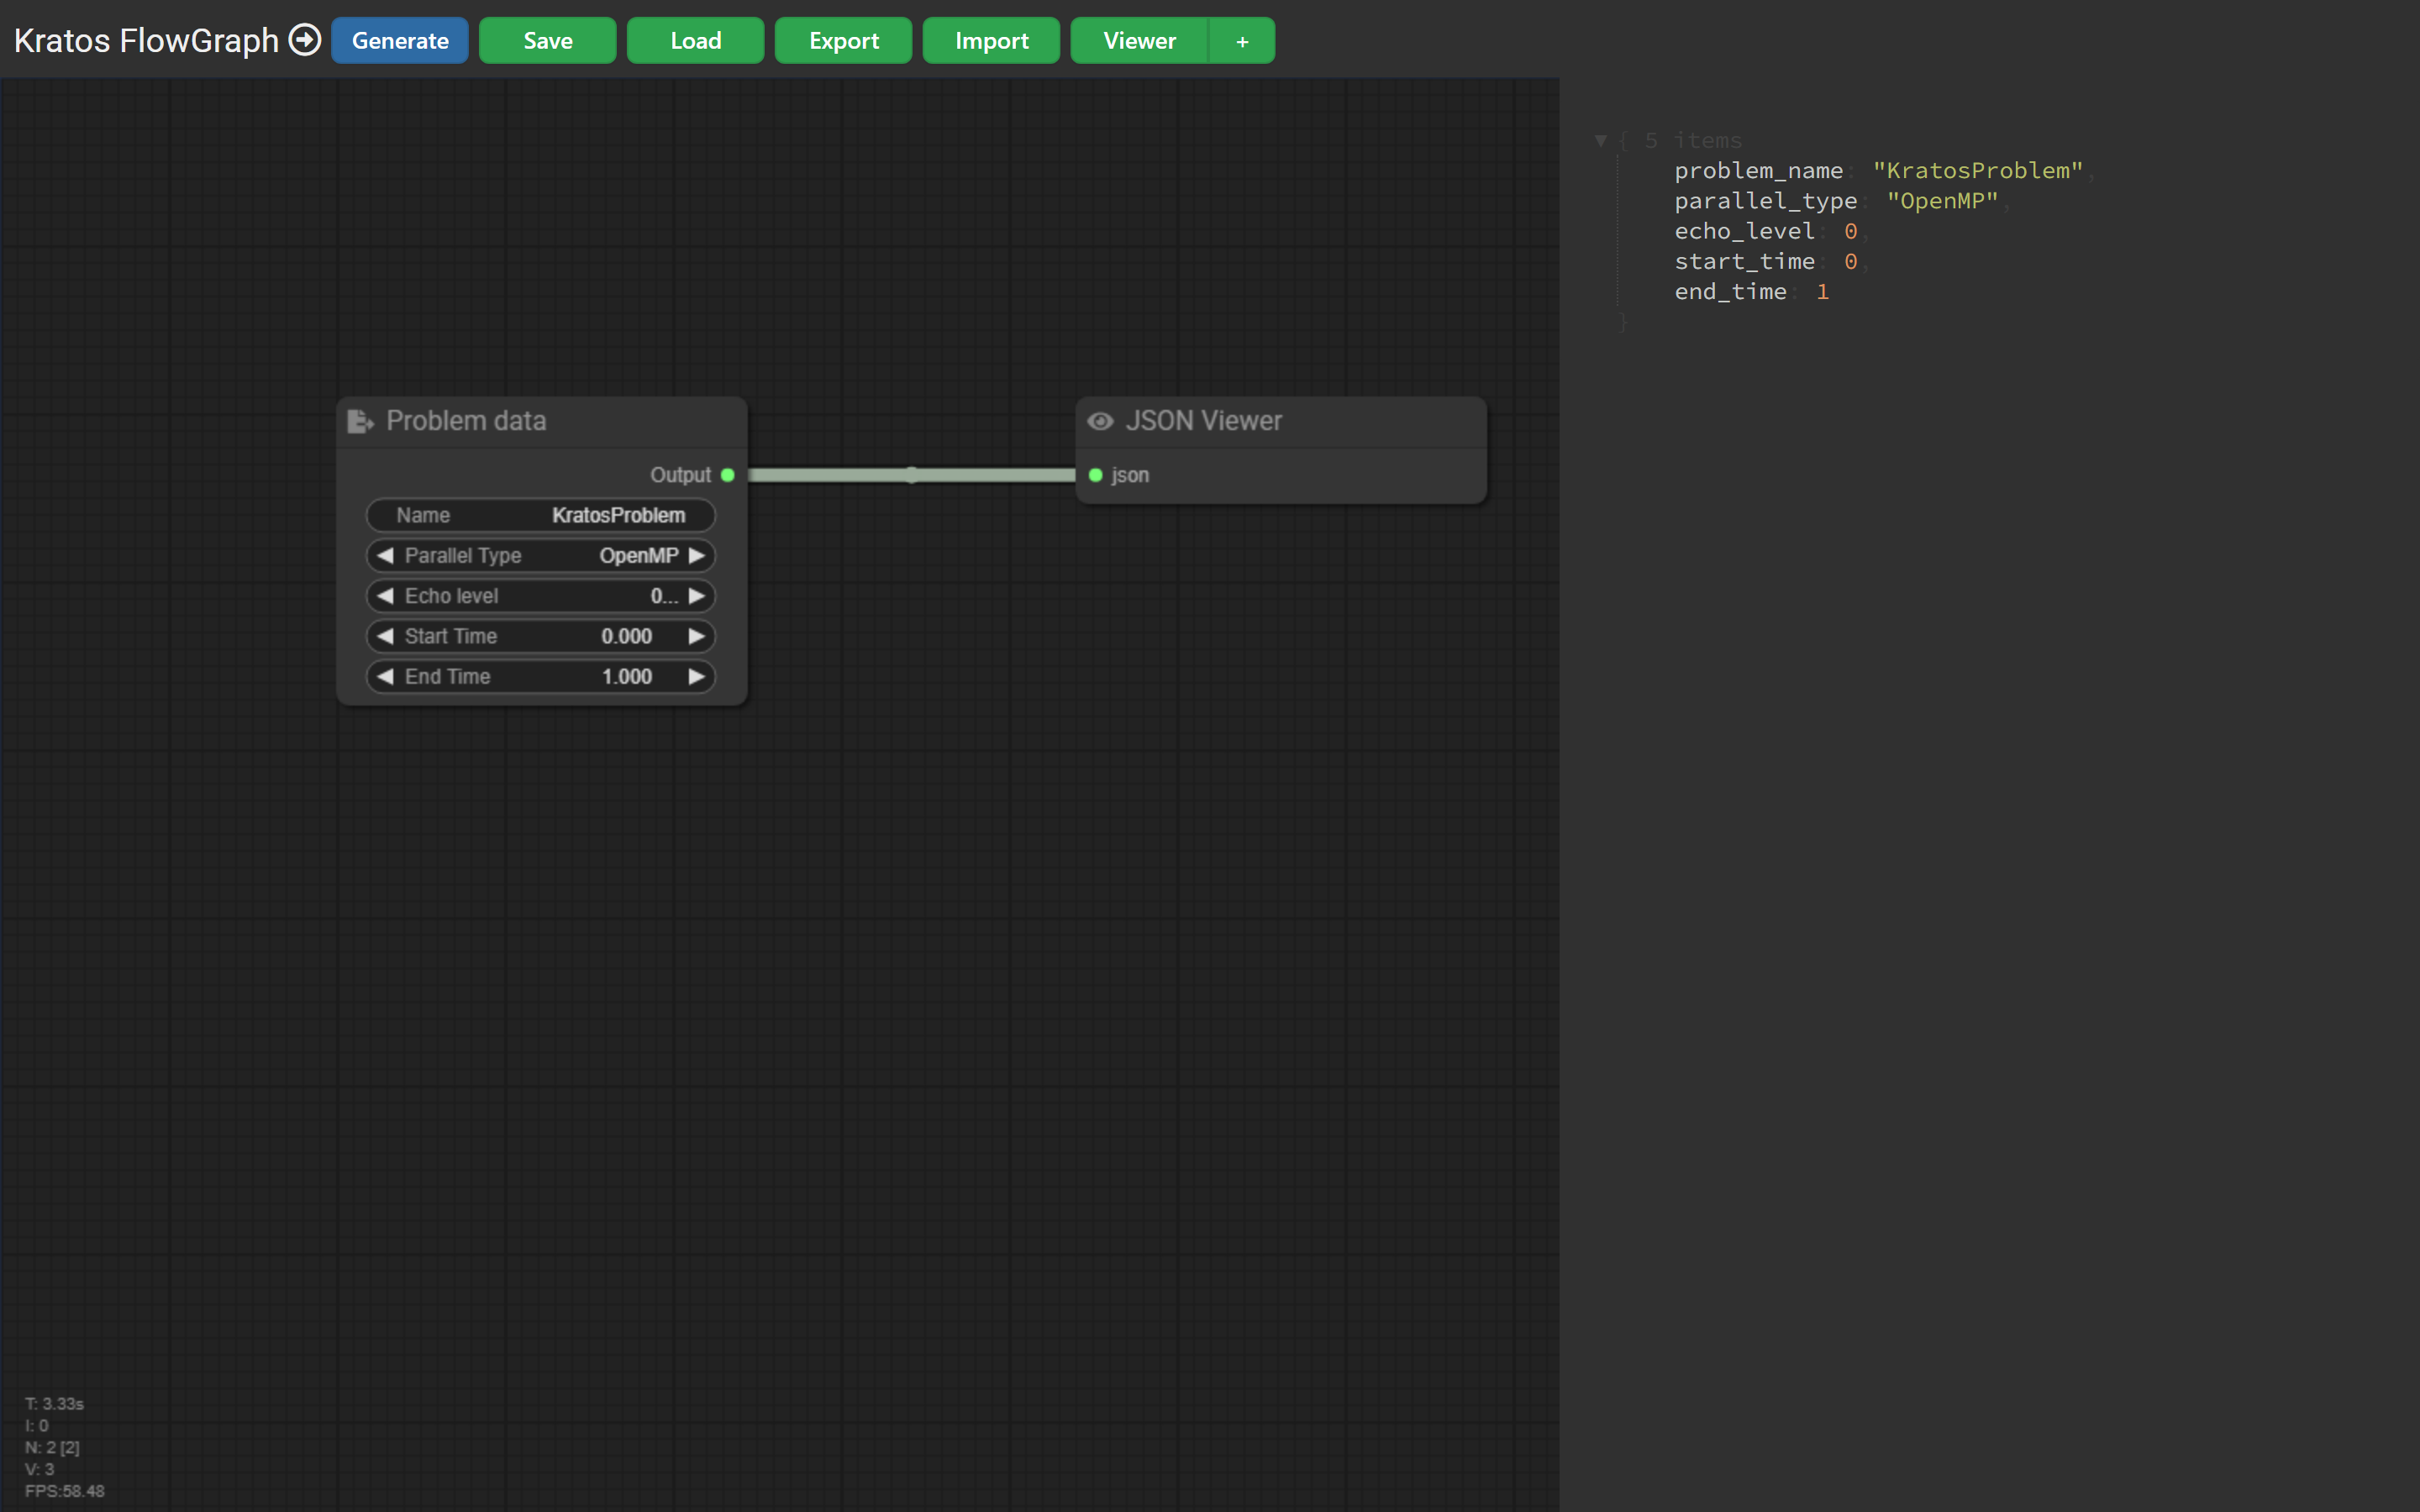
+ (Add Viewer node)
Adds an IO/JSONView node to the canvas (addViewerNode()). Connect any JSON-producing output into its json input, click Generate, and open the Viewer panel to inspect the result live.
Canvas interactions
Beyond the toolbar, the canvas itself supports the standard litegraph interactions, extended by FlowGraph:
| Interaction | Result |
|---|---|
| Right-click canvas → Add Node | Opens the categorized node library (extended_menu.js). |
| Drag output → input | Creates a connection between two nodes. |
| Drag node | Moves it; drag canvas pans the view; scroll zooms. |
| Click a widget | Edits the property inline (text / number / combo / toggle / button). |
| Select + Delete | Removes nodes (remove_node.js). |